[求助] Altair 如何显示部分X轴标签
-
@哆哆
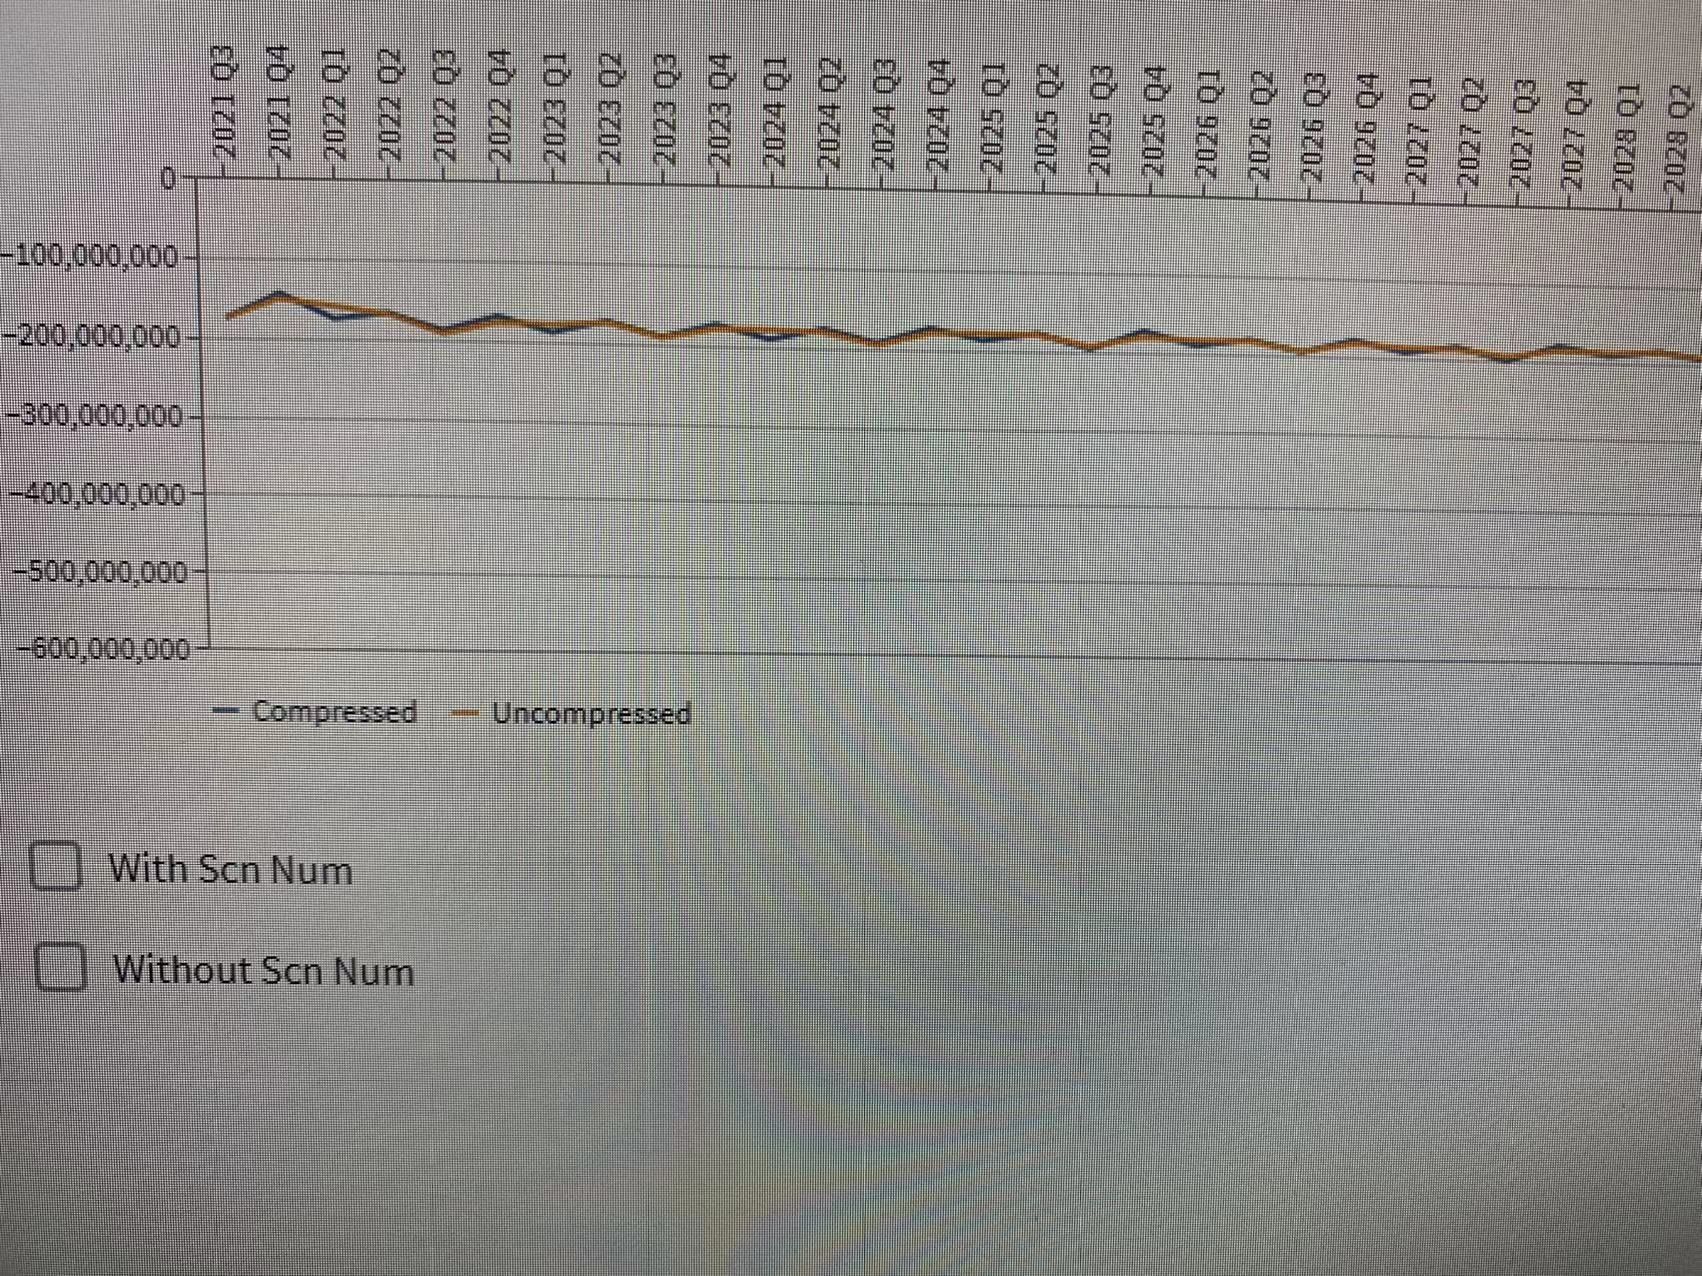
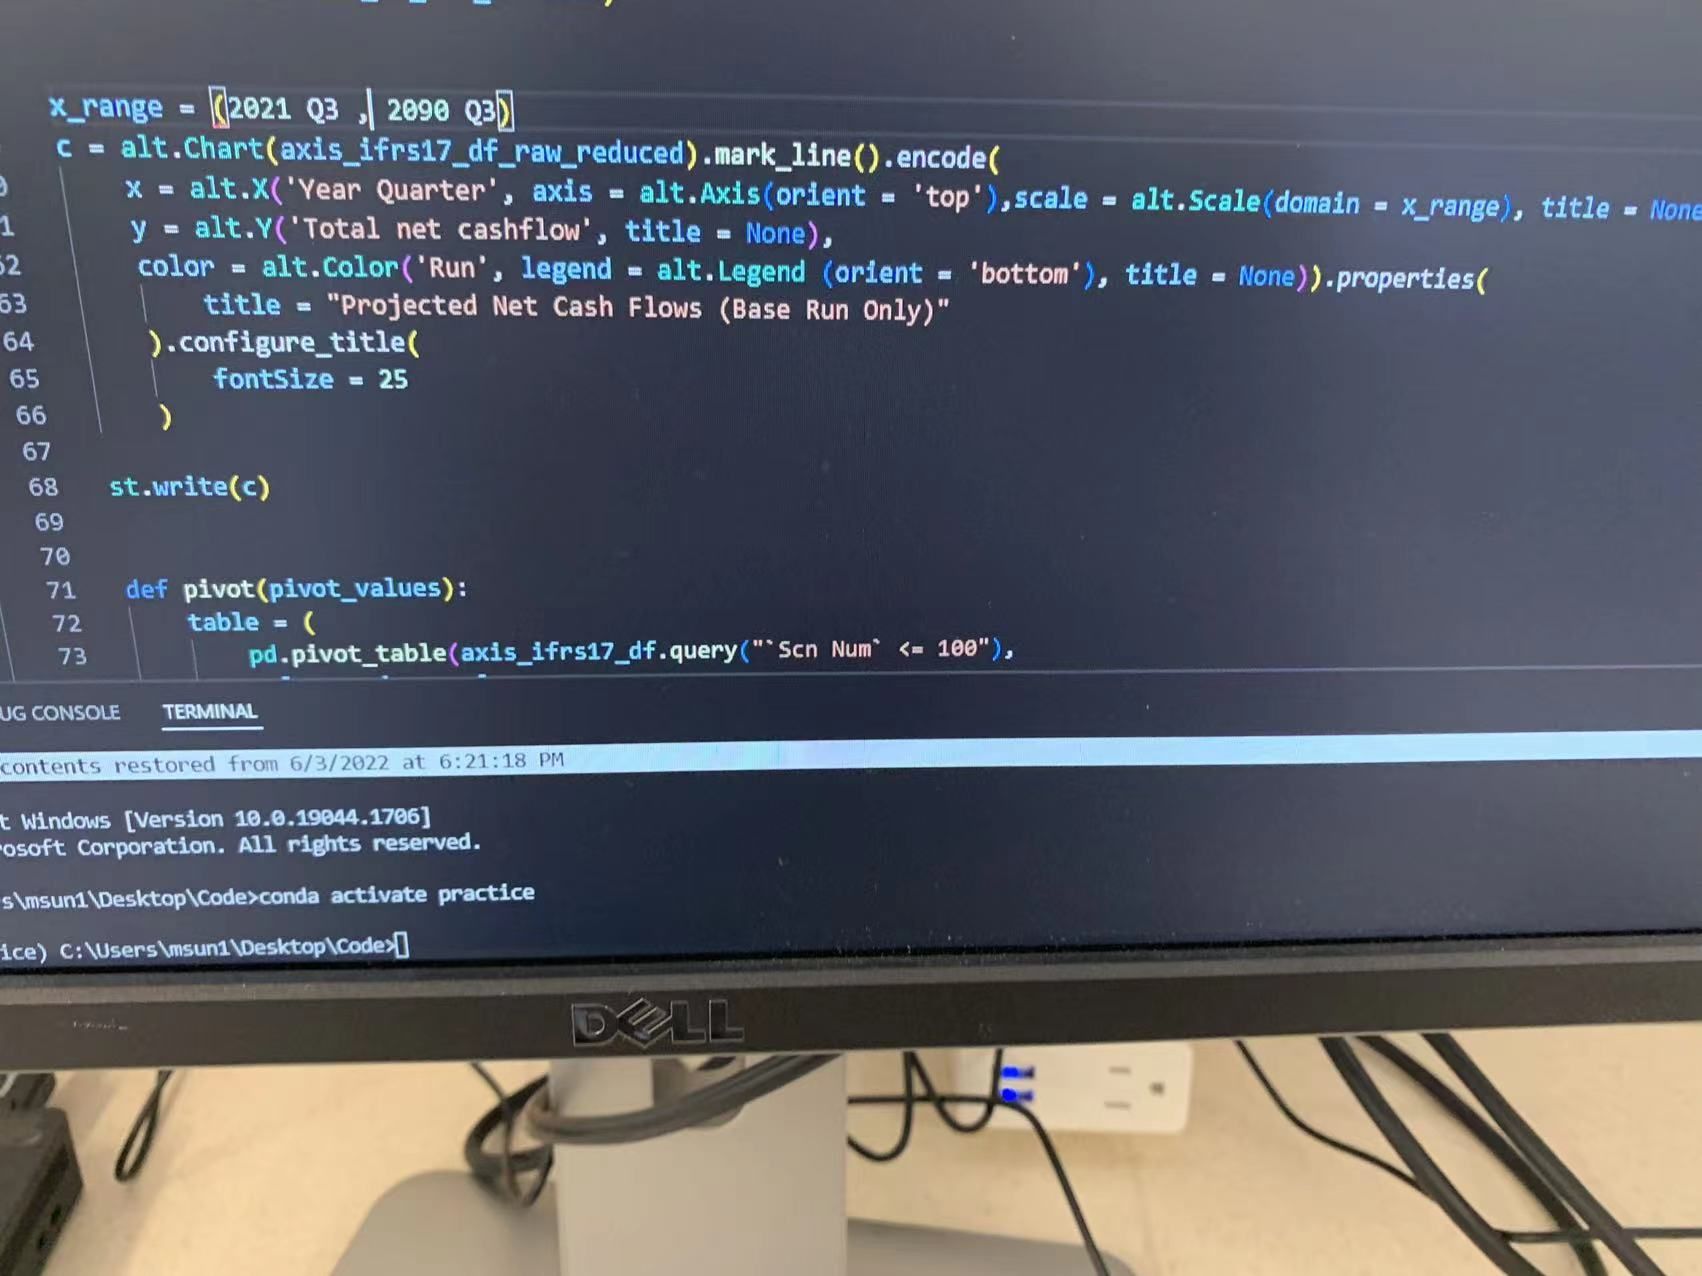
Python 大神们,求助! Altair package,alt.chart 保留所有data,但是想摆脱掉Q1, Q2, Q4 只显示所有年份的Q3。有会的嘛!

-

-
想了两种方法都可以用
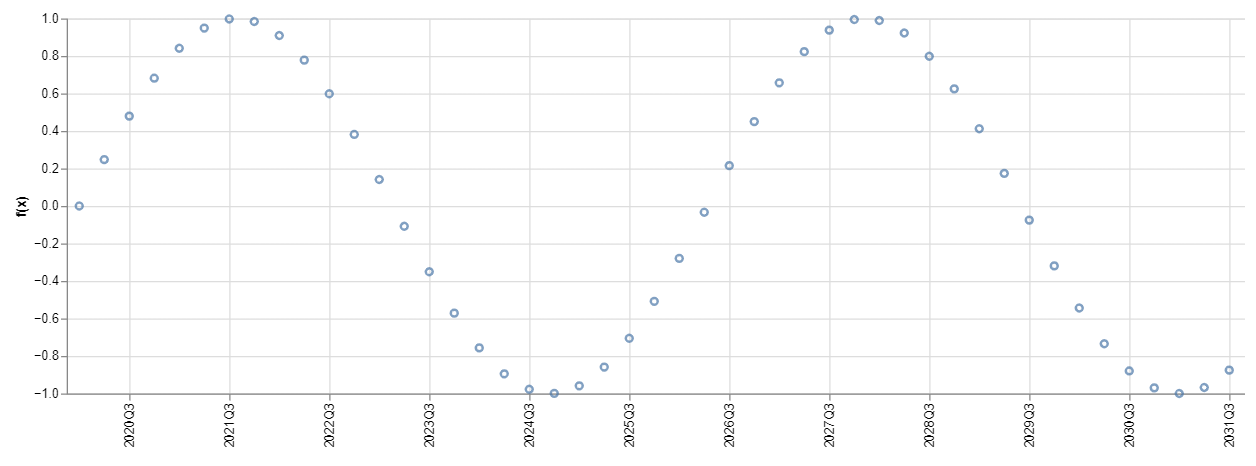
1.import altair as alt import numpy as np import pandas as pd # 生成一系列Quarter,Qtrs_with_Q3是把所有非Q3的Quarter替换成"" Qtrs = [ str(2020+int(x))+"Q"+str(int((x-int(x))*4)+1) for x in np.arange(100)/4] Qtrs_with_Q3 = [x if (x[-1]=="3") else "" for x in Qtrs] # y是随机生成的 y = np.arange(100)/4 source = pd.DataFrame({ 'x': Qtrs, 'f(x)': np.sin(x / 4) }) # 生成图 chart = alt.Chart(source).mark_point().encode( x=alt.X('x', axis=alt.Axis(labelFontSize=10,values=Qtrs_with_Q3,grid=True)), y='f(x)' )
-
方法二,只改变画图的部分
chart2 = alt.Chart(source).mark_point().encode(
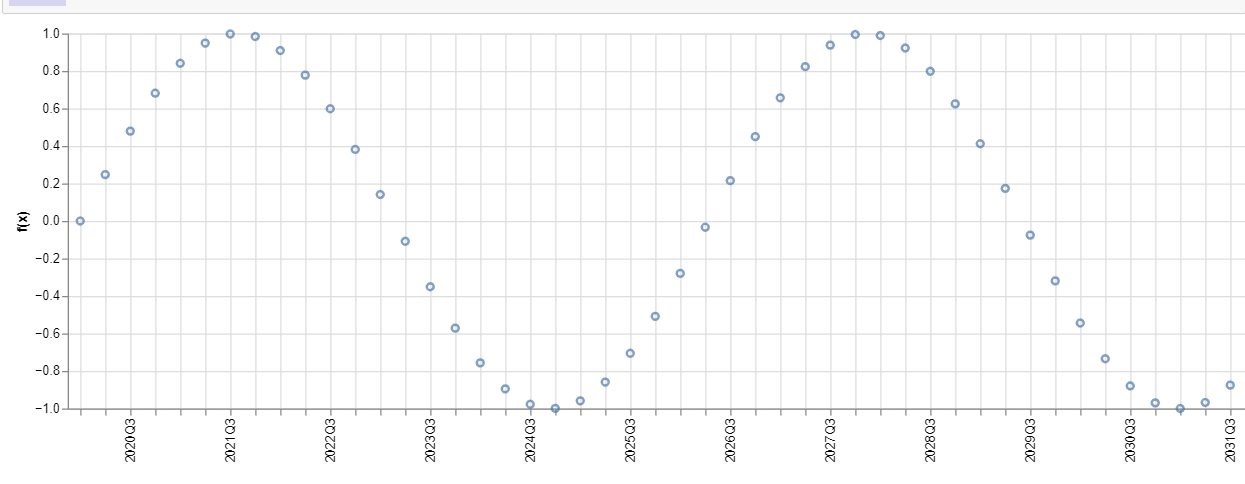
    x=alt.X('x', axis=alt.Axis(labelFontSize=10,grid=True,labelExpr='slice(datum.label ,-1) == 3 ? datum.label: null')),
    y='f(x)'
)
chart2
-
Reference:
https://altair-viz.github.io/user_guide/generated/core/altair.Axis.html
https://vega.github.io/vega/docs/expressions/